

详细内容
AI-Powered Stock Picking
Invest with the odds in your favor. Get unique insights, boost your portfolios, and make smart data-driven investment decisions.

Popular stocks:
Stocks ranking:
ETFs ranking:
Trade Ideas:
Video: How to Use Danelfin

Best Stocks and ETFs Picked by AI
 November 29, 2025.For a 3-month investment horizon.
-
 Top Stocks
-
 ETFs
 Trade Ideas
Popular Stocks Ranked by Danelfin AI
US-listed stocks are ranked according to the AI Score, which rates the probability of beating the market in the next 3 months.
RankRanking based on AI Score, the lower the ranking, the better
CompanyCompany name
CountryCountry where the headquarters are located
AI Score Danelfin AI global score based on all data available (1-10)
ChangeChange in AI Score vs the previous day
FundamentalDanelfin AI subscore only based on company fundamental indicators (1-10)
TechnicalDanelfin AI subscore only based on technical indicators produced by price & volume (1-10)
SentimentDanelfin AI subscore only based on sentiment indicators (1-10)
Low RiskRisk subscore based on the negative price fluctuations (semi-deviation) latest 500 market days. The higher the score, the lower the downside risk.
Perf YTD


Country
1
ACHRArcher Aviation Inc
 United States

AI Score (from 1 to 10) based on the probability of beating the market in 3 months (67.97%) vs the average probability (%) of all stocks. The "market" is the S&P 500 for US stocks and the STOXX 600 for European stocks.
 0


-20.10%
2
AGFirst Majestic Silver Corporation
 Canada
AI Score (from 1 to 10) based on the probability of beating the market in 3 months (67.74%) vs the average probability (%) of all stocks. The "market" is the S&P 500 for US stocks and the STOXX 600 for European stocks.
0


177.41%
3
EXK
 Long Trade Idea with a win rate of over 60% after past BUY signals (1, 3, or 6M).Endeavour Silver Corp
Canada
AI Score (from 1 to 10) based on the probability of beating the market in 3 months (67.37%) vs the average probability (%) of all stocks. The "market" is the S&P 500 for US stocks and the STOXX 600 for European stocks.
 -1
171.31%
4
BBarrick Mining Corp
United States
AI Score (from 1 to 10) based on the probability of beating the market in 3 months (67.32%) vs the average probability (%) of all stocks. The "market" is the S&P 500 for US stocks and the STOXX 600 for European stocks.
0
166.71%
5
NFLXNetflix Inc
United States
AI Score (from 1 to 10) based on the probability of beating the market in 3 months (66.99%) vs the average probability (%) of all stocks. The "market" is the S&P 500 for US stocks and the STOXX 600 for European stocks.
0
20.70%
See the full US Popular Stocks ranking
Top Stocks in:
 Austria

 Europe
 Belgium
 Denmark
 Finland
 France
What Our Users Say
Trusted by over 100,000 users
"Danelfin is an extraordinary tool for checking out new investment ideas or to browse for new prospects. I have found more than a few big winners by browsing the top-ranked AI Scores, stocks I didn't find specifically mentioned on any other service. I routinely check the scores of my portfolio to know when to consider exiting an existing position or opening a new one."
Garret S. -USA


Smart Investing Made Easy for Everyone
Danelfin’s AI does the hard work, analyzing +10,000 features per day per stock and rating stocks probability of beating the market with the AI Score.


LowAverageHigh
Probability of Beating the Market in 3 Months
Data Analyzed to Calculate the AI Score
+900Daily indicators per stock.
+10,000Daily features per stock.
+5 BillionFeatures used to learn.
+600 technical, 150 fundamental, and 150 sentiment daily indicators per stock, processed into more than +10,000 daily features by our Artificial Intelligence.
Use Cases
Pick the Winners. Avoid the Losers
Since 2017, US-listed stocks with the highest AI Score (10/10) outperformed the market by +21.05% on average after 3 months (annualized alpha), while stocks with the lowest AI Score (1/10) underperformed the market by -33.28% on average (annualized alpha).


Generate Superior Returns
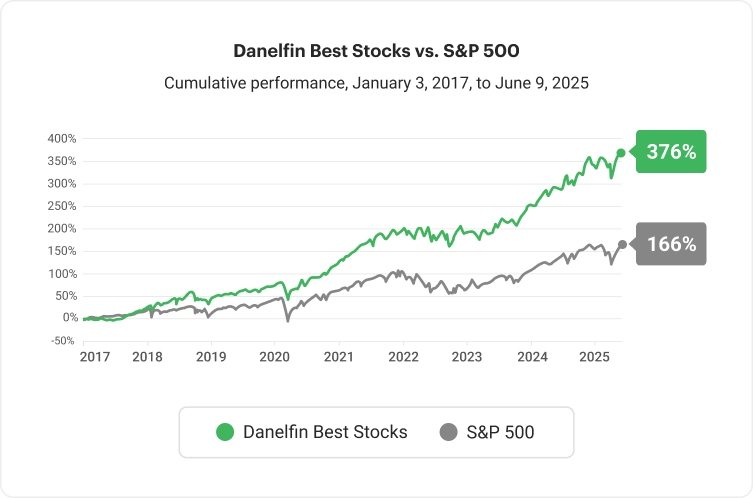
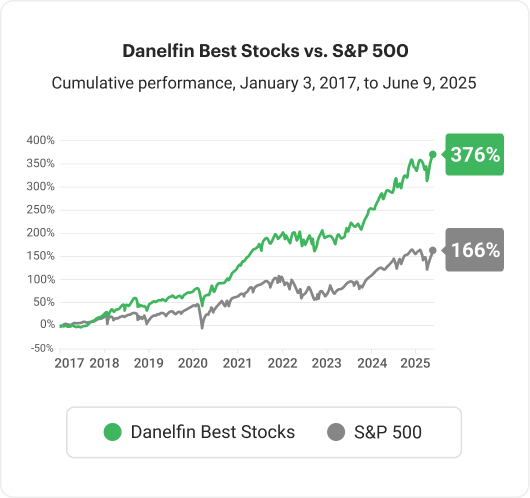
We built an investment strategy for US-listed stocks, using the Danelfin AI Score to demonstrate the predictive capabilities of our Artificial Intelligence.
The AI-powered Danelfin Best Stocks strategy generated a return of +376% from January 3, 2017, until June 9, 2025, vs. only +166% of the S&P 500 in the same period.
Check Danelfin Best Stock Strategy
Trade Ideas: Stocks With the Best Track Record
Discover potential trades where Danelfin AI has been sharp in the past since 2017, with at least a 60% win rate for Buy or Strong Buy signals (Long) and at least a 60% loss rate for Sell and Strong Sell signals (Short).
See the historical track record of buy/sell signals on top of the price chart and the expected forecast of our AI for the next 1, 3, and 6 months.


Understand the Stock Features Used to Calculate the AI Scores
Danelfin uses Explainable AI. There are no “black boxes.” The stock features (alpha signals) that our Artificial Intelligence analyzes to calculate every AI Score are transparent and easy to understand.


Track the AI Score Evolution of the Stocks in Your Portfolio
Monitor the daily AI Score changes of your stocks. Receive alerts when a stock in your portfolio is downgraded or upgraded, so you can make the necessary adjustments.
Thanks to portfolio tools like Average AI Score, Portfolio Diversity Score, and daily alerts, you can track and improve your portfolios' probability of beating the market.


Identify the Best Moment to Invest in Your Favorite Stocks
To invest with the odds in your favor, keep a close eye on your preferred stocks until they receive a Buy or Strong Buy rating (AI Score 7 to 10).
The AI Score's evolution enables you to check if the probability of a stock outperforming the market is increasing or decreasing over time. To maximize your chances of success, choose stocks with a rising probability of beating the market.


Join for Free and Create Your First Portfolio
Nobody can predict the future, but our Artificial Intelligence puts the odds in your favor
It is impossible to predict perfectly which stocks will beat the market, as stock prices and market behavior can be affected by multiple unpredictable events and forces. But we work hard to continuously improve our Artificial Intelligence capacity to detect trends, learn from past events, and achieve the highest possible alpha success rate.
Our data demonstrate that our AI models successfully separate, on average, the stocks that beat the market in the next 3 months from those that don't.
How to Use Danelfin


Featured in:


Start Making Smarter Investment Decisions
Our AI-powered stock analytics platform will help you pick the best stocks and optimize your portfolios' performance.