

详细内容
AI-Powered
Data Report Agent
From Excel to 20+ Pages of
McKinsey-Level Insights
— In One Click.



Loved by over 100,000 users worldwide
Sign up for free


Generated Reports Examples
 \
\
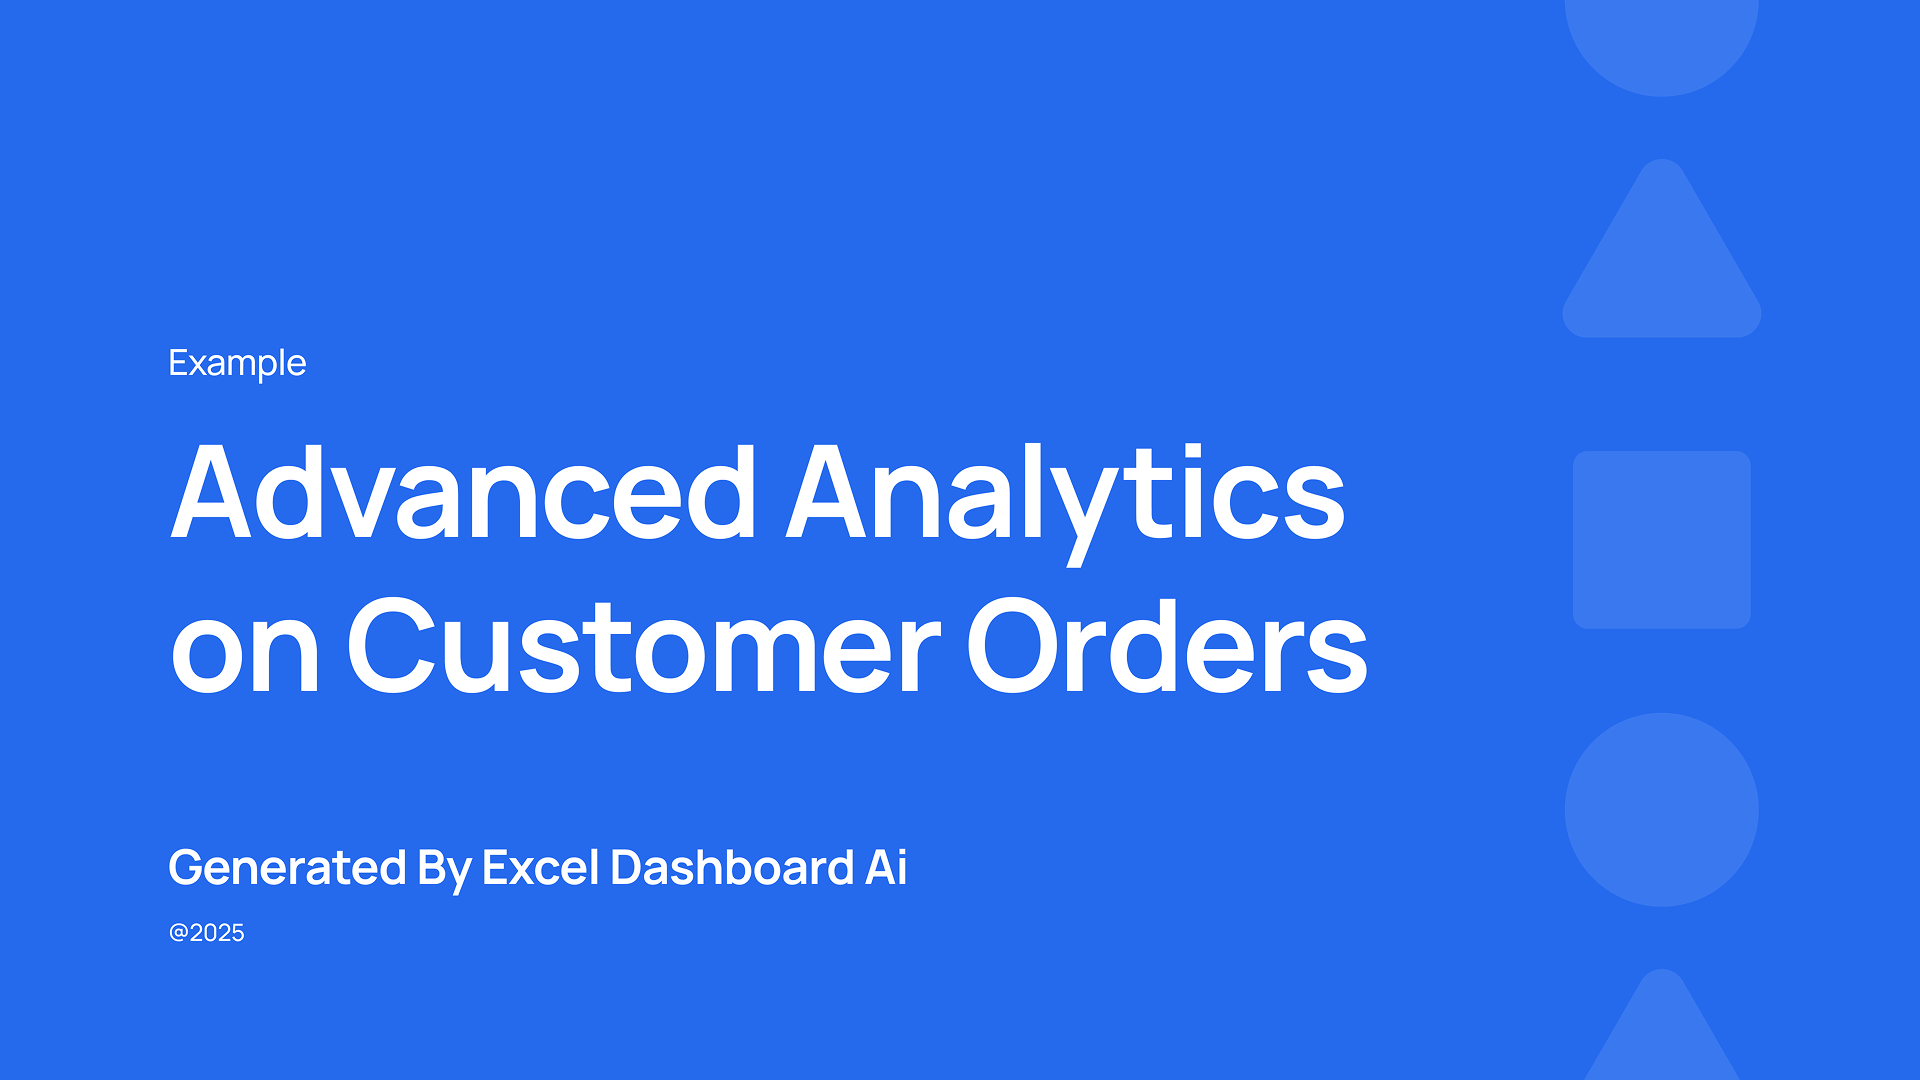
Advanced Analytics on Customer Orders\
\
♥8w+\
\
Powered by ExcelDashboard Ai  \
\
Global Education Data Insights Report\
\
♥6w+\
\
Powered by ExcelDashboard Ai  \
\
E-commerce Customer and Sales Analytics\
\
♥10w+\
\
Powered by ExcelDashboard Ai
From 0 to 60,000 Users – Excel Dashboard 2.0 Is Finally Here! - YouTube
Photo image of Excel Dashboard Ai
Excel Dashboard Ai
18 subscribers
From 0 to 60,000 Users – Excel Dashboard 2.0 Is Finally Here!
Excel Dashboard Ai
Search
Watch later
Share
Copy link
Info
Shopping
Tap to unmute
If playback doesn't begin shortly, try restarting your device.
You're signed out
Videos you watch may be added to the TV's watch history and influence TV recommendations. To avoid this, cancel and sign in to YouTube on your computer.
CancelConfirm
More videos
More videos
Share
Include playlist
An error occurred while retrieving sharing information. Please try again later.
0:00
0:00 / 0:39
•Live
•

Batch Analysis
Explore diverse data dimensions easily.
Try now →

Reports
Generate analysis reports instantly.
Try now →

Insights
Ask questions and get immediate answers.
Try now →

BACKED BY

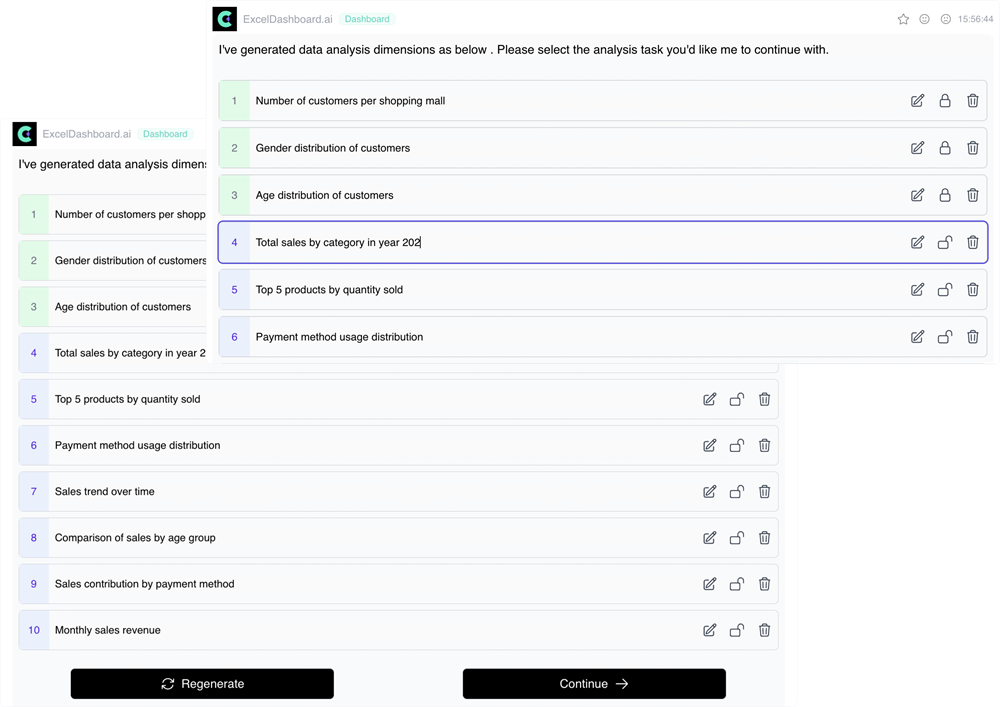
Let AI explore diverse data dimensions for you!
- Generate 10 different data analysis dimensions in seconds for you to choose from
- Edit and lock in your preferred analysis perspectives using natural language
- Quickly re-generate new analysis dimensions
Generate interactive dashboard with a single click
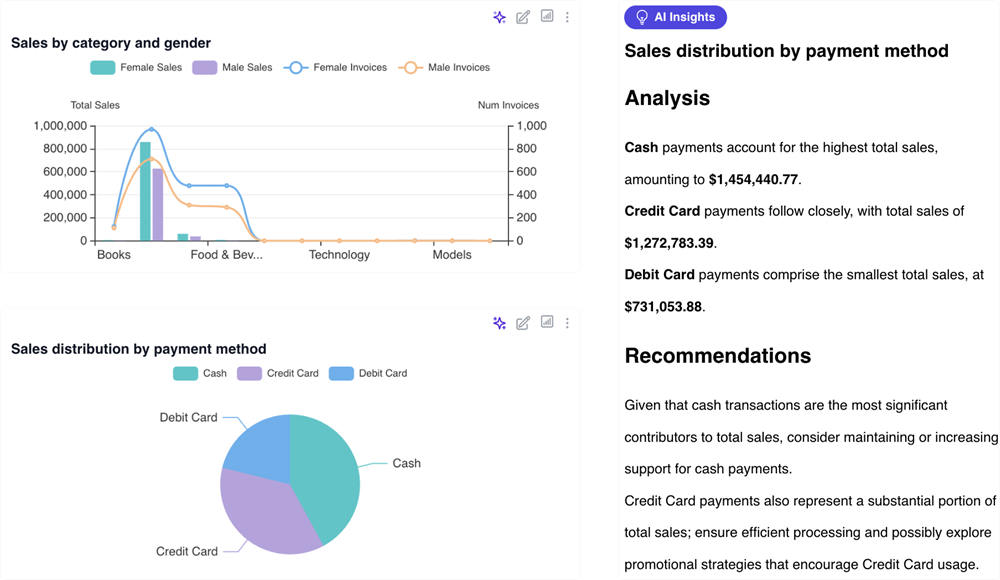
- Excel Dashboard Ai handles all the programming and visualization, instantly creating an interactive dashboard for you
- Let AI interpret each chart's meaning and highlight key information
- Easily generate new charts with natural language commands and add them to your dashboard with a single click
Download your dashboard as a comprehensive data analysis report
- Convert all charts from your dashboard into a detailed, 20+ page report
- The charts in the report are fully editable, allowing for easy adjustments and customization

Unleash Al-powered data capabilities with ExcelDashboard now!
Sign up for free
AI-Powered
Data Report Agent
From Excel to 20+ Pages of
McKinsey-LevelInsights
— In One Click.
Loved by over 100,000 users worldwide
Sign up for free
Generated Reports Examples
\
\
Advanced Analytics on Customer Orders\
\
♥8w+\
\
Powered by ExcelDashboard Ai \
\
Global Education Data Insights Report\
\
♥6w+\
\
Powered by ExcelDashboard Ai \
\
E-commerce Customer and Sales Analytics\
\
♥10w+\
\
Powered by ExcelDashboard Ai
From 0 to 60,000 Users – Excel Dashboard 2.0 Is Finally Here! - YouTube
Photo image of Excel Dashboard Ai
Excel Dashboard Ai
18 subscribers
From 0 to 60,000 Users – Excel Dashboard 2.0 Is Finally Here!
Excel Dashboard Ai
Search
Watch later
Share
Copy link
Info
Shopping
Tap to unmute
If playback doesn't begin shortly, try restarting your device.
More videos
More videos
You're signed out
Videos you watch may be added to the TV's watch history and influence TV recommendations. To avoid this, cancel and sign in to YouTube on your computer.
CancelConfirm
Share
Include playlist
An error occurred while retrieving sharing information. Please try again later.
0:00
0:00 / 0:39
•Live
•
Batch Analysis
Explore diverse data dimensions easily.
Try now →
Reports
Generate analysis reports instantly.
Try now →
Insights
Ask questions and get immediate answers.
Try now →
BACKED BY
Let AI explore diverse data dimensions for you!
- Generate 10 different data analysis dimensions in seconds for you to choose from
- Edit and lock in your preferred analysis perspectives using natural language
- Quickly re-generate new analysis dimensions
Generate interactive dashboard with a single click
- Excel Dashboard Ai handles all the programming and visualization, instantly creating an interactive dashboard for you
- Let AI interpret each chart's meaning and highlight key information
- Easily generate new charts with natural language commands and add them to your dashboard with a single click
Download your dashboard as a comprehensive data analysis report
- Convert all charts from your dashboard into a detailed, 20+ page report
- The charts in the report are fully editable, allowing for easy adjustments and customization
Unleash Al-powered data capabilities with ExcelDashboard now!
Sign up for free