

详细内容
!!!###!!!title=VisActor ——Narrative-Oriented Intelligent Visualization Solutions!!!###!!!!!!###!!!description=VisActor is derived from a large number of visualization scenes of ByteDance. While covering conventional visualization scenarios, with narrative visualization as a new focus and intelligent visualization as the goal, VisActor provides a intelligent visual solution composed of multiple modules including rendering engine, visualization grammar, data analysis component, chart component, table component, GIS component, graph visualization component and surrounding ecology.!!!###!!!

Productions


Not only an out-of-the-box multi-terminal chart library, but also a vivid and flexible data storyteller.

Not only a high-performance multi-dimensional data analysis form, but also a grid artist created between rows and columns.

It is not only a visual grammar that generates thousands of charts, but also a data magician who turns boring into magic.

Not only a visual rendering engine with rich functions, but also a handy pen.

Not just automatic, but also fantastic.

Intelligent visual storytelling, data story creation framework.


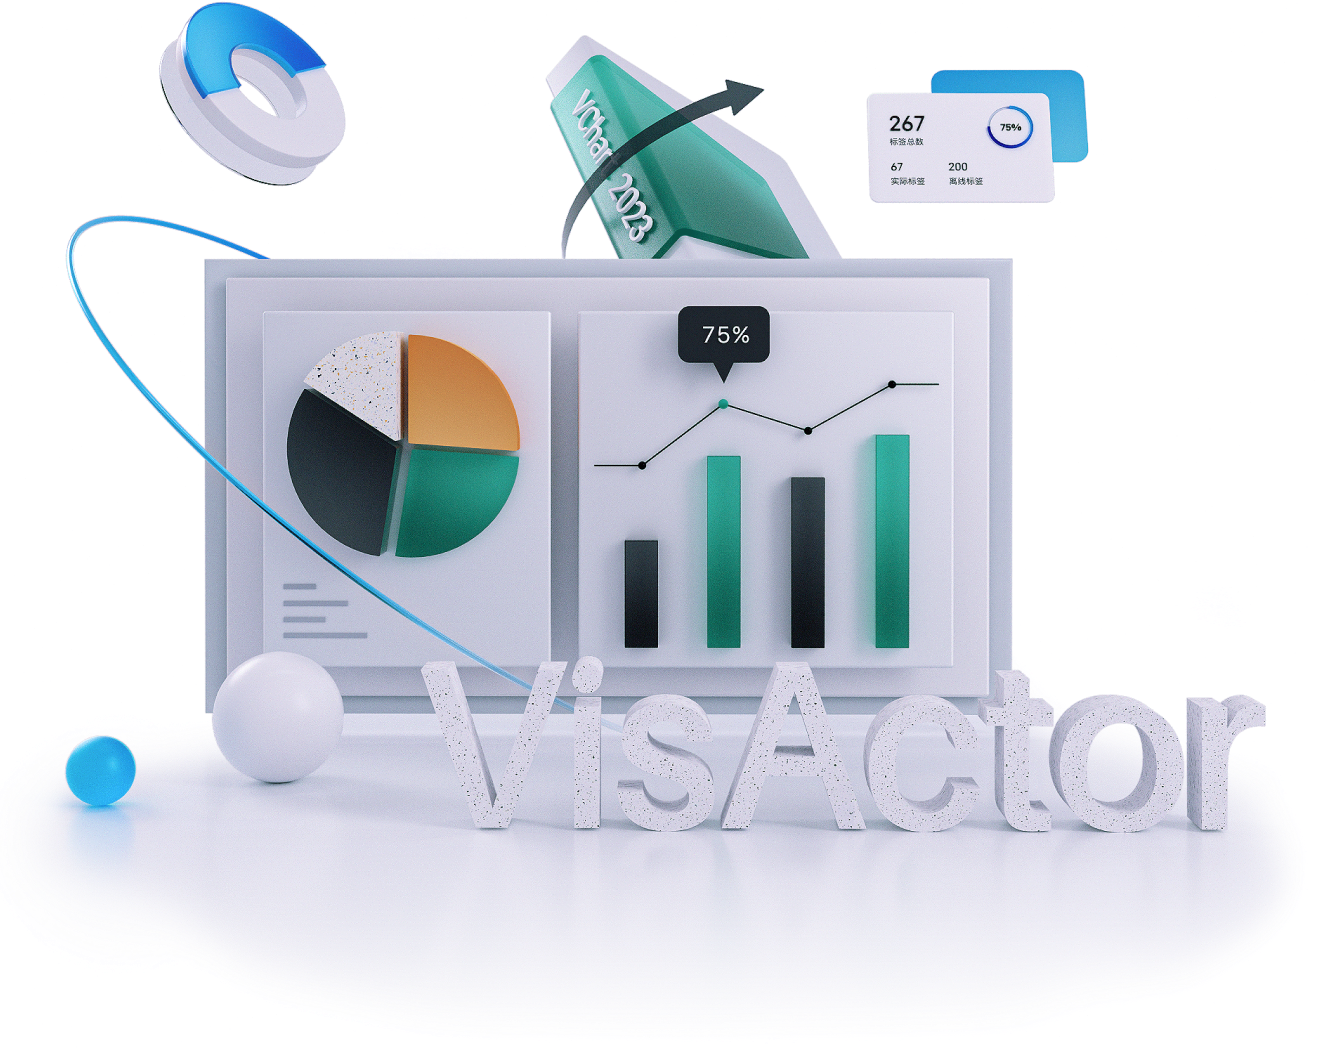

The more beauty you see,
the more insights you gain.
New!
Bytedance Open Source
Presenting
The Beauty Of Data
VisActorNarrative-Oriented Intelligent Visualization Solutions

VChart

VTable

VMind

Star On Github
Introduction
PRODUCTION INTRODUCTION

VisActor
Product Introduction
Usage scenario
Join Us
VisActor
Visualization Solutions
Narrative-Oriented Intelligent Visualization Solutions

USAGE SCENARIO
VisActororiginates from a large number of visual scenes. While covering traditional visualization scenarios, with narrative visualization as the new focus and intelligent visualization as the future goal.
VisActor
Product Introduction
Usage scenario
Join Us
SCENARIO
Large screen visualization / BI / IM

·Large Screen
Large Screen Visualization

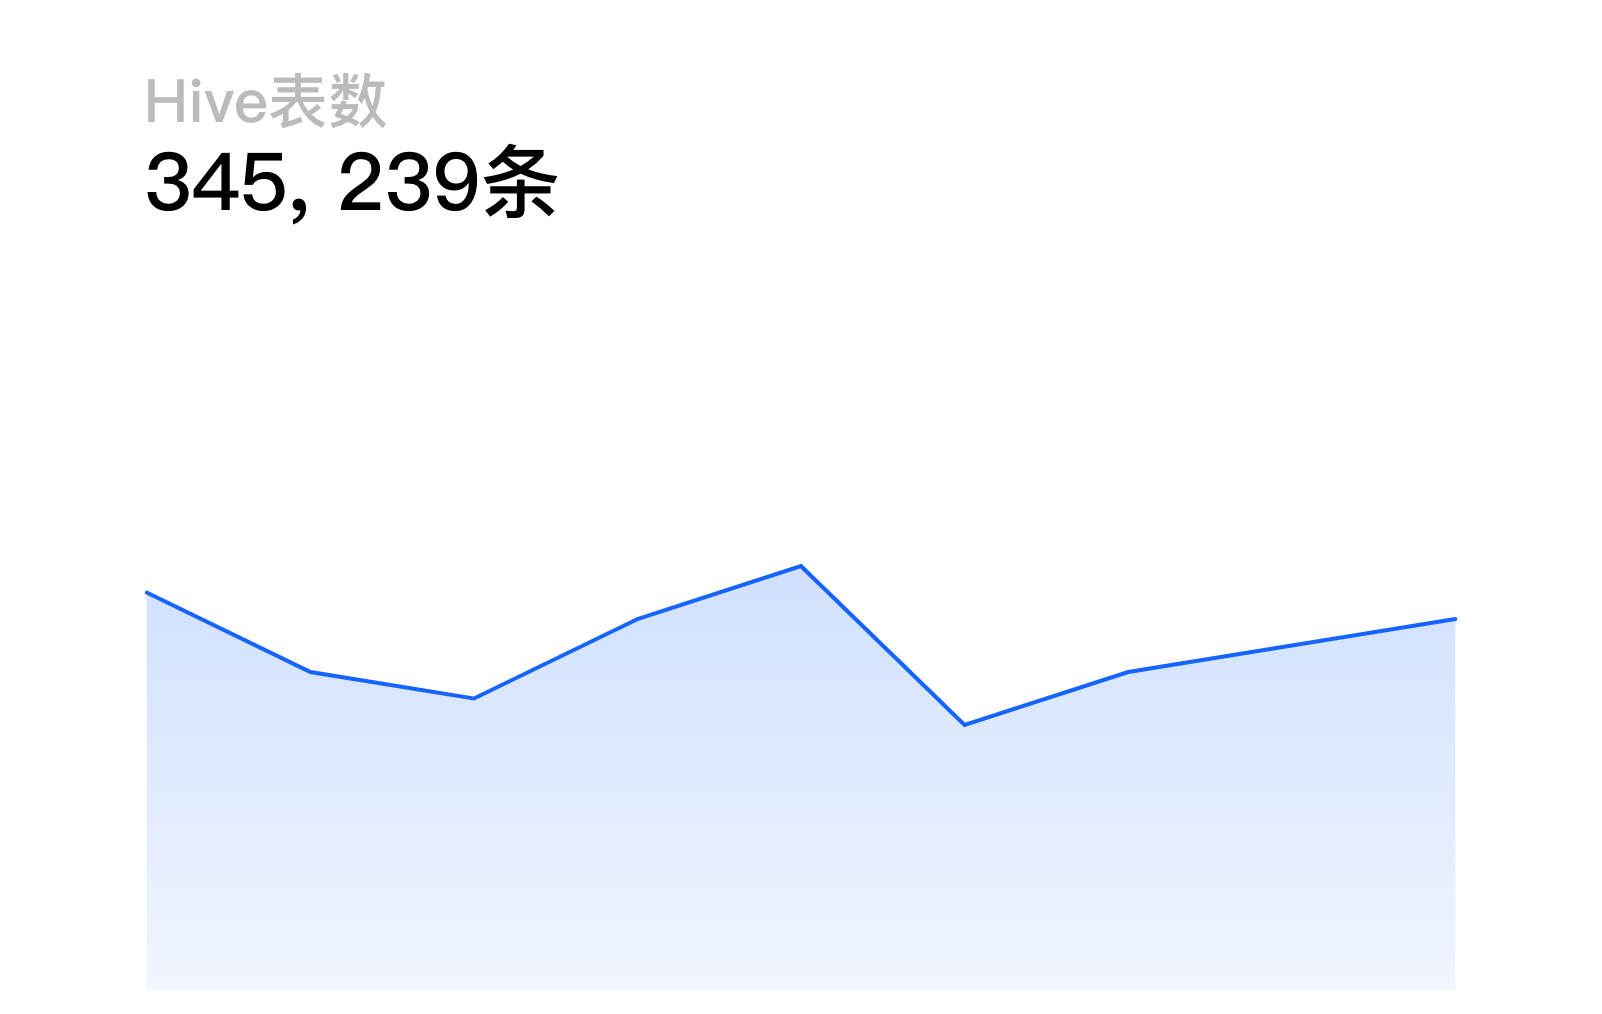
Rich chart types, various animation effects, dynamic data update capabilities, excellent multi-chart rendering performance, and fast generation of cool data large screens.

·BI
Business Intelligence
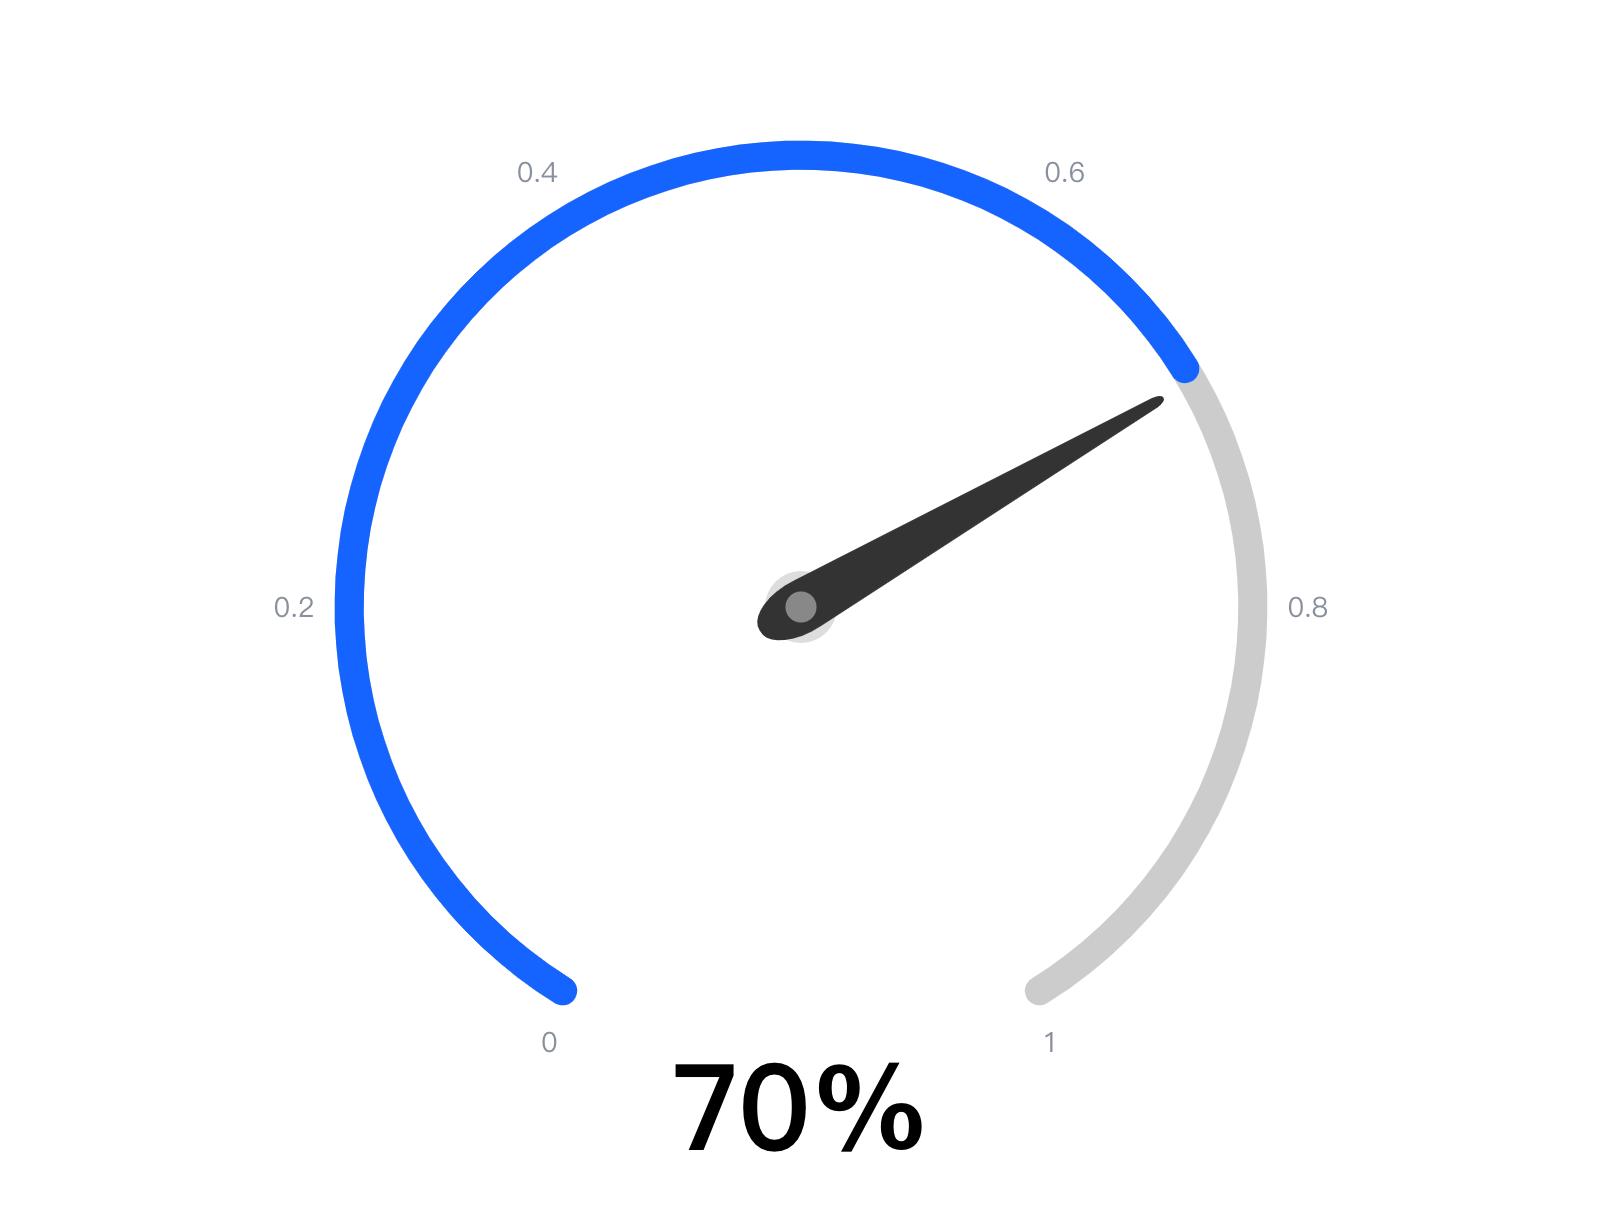
Chart styles, layouts, animations, etc. all support custom configurations; built-in data analysis capabilities meet various visualization needs in BI scenarios.

·Office Suite
Office Suite
Good compatibility in various end environments, excellent rendering performance, and also meet various visualization requirements in office application scenarios.
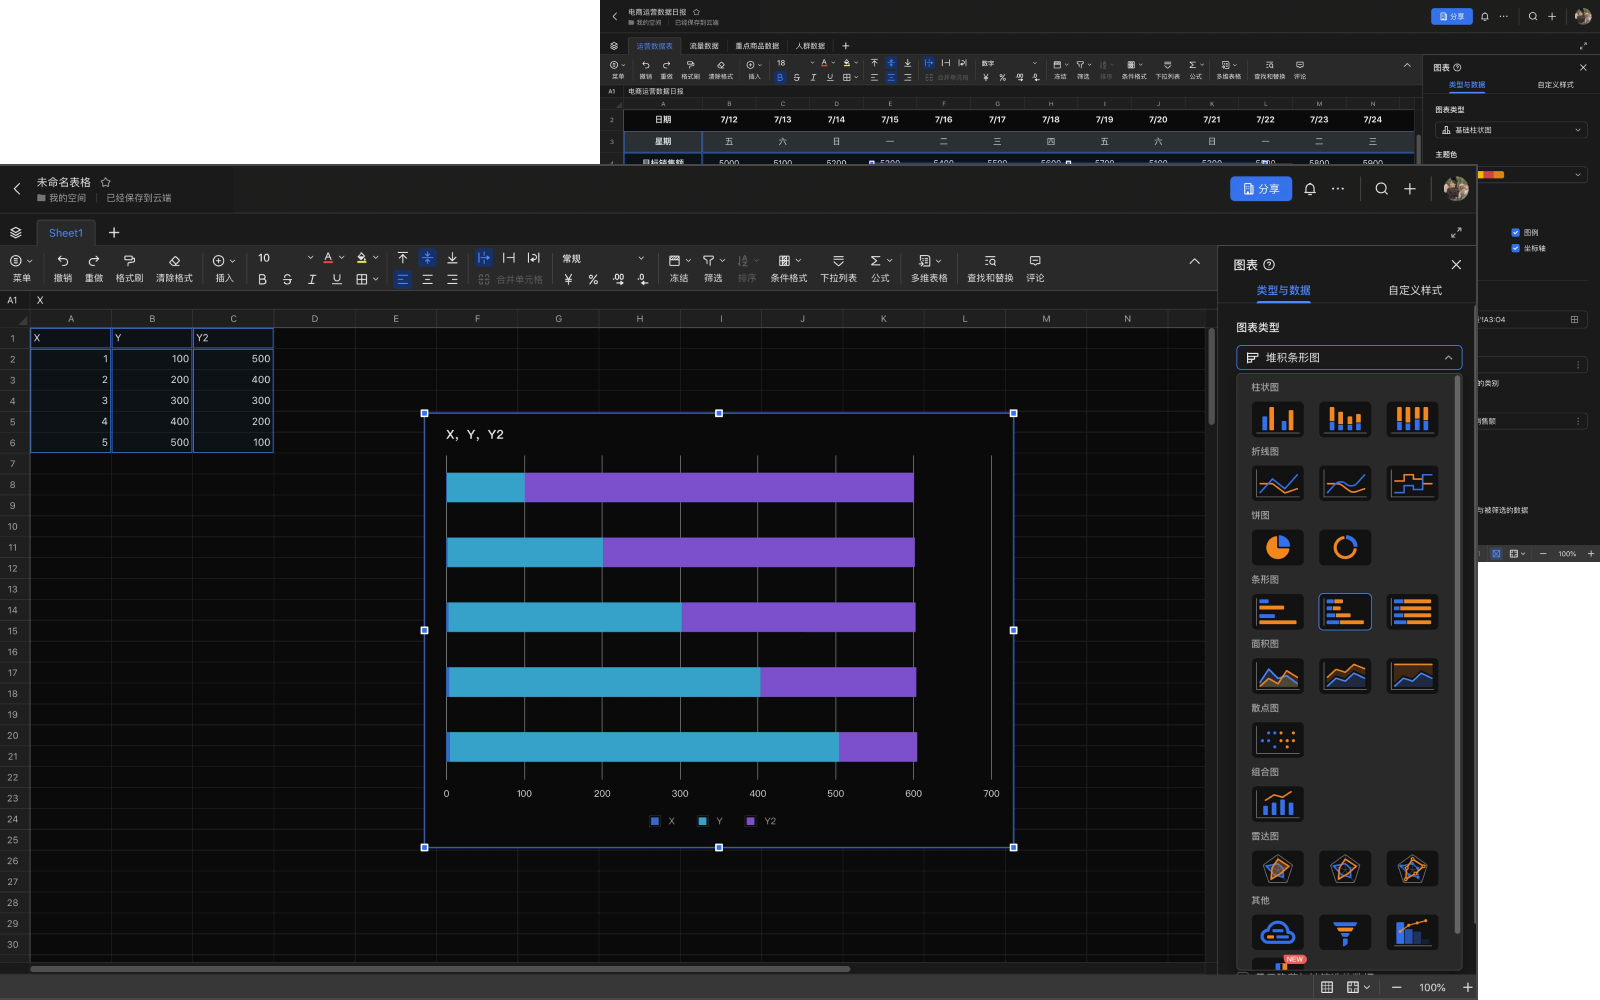



New!
Bytedance Open Source
Presenting
The Beauty Of Data
The more beauty you see, the more insights you gain.
VChart
VTable
VMind
Star On Github

The More Beauty You See,
The More Insights You Gain.
Supported Products
 Volcano Engine
  Lark
Lark  Tiktok
  Capcut
The More Beauty You See,
Learn More
 Medium
 Observable
The More Insights You Gain.
Contact Information
 Discord